What are Multilevel Models?
Multilevel Models (also known as mixed effects, nested or hierarchical data models) are used to find the effects of levels on a predictor variable. These hierarchical levels can be geographical, such as cities within counties, or organizational, products within stores. This method is useful to determine how factors affect the variation between a unit and the group. Multilevel models are gaining popularity in the areas of organizational psychology, education research, and the geographical sciences.
1. Data - First, as its alternative names suggest, data needs to be nested. There is no specific number for a data sample; however, the smaller the dataset, the more prone to errors such as bias.
For example, in my dissertation I used a two-level model for a dataset including 327 units (municipalities) nested within 12 geographical divisions:
Once you have made sure your data is nested, you can run a single level regression using your units to choose the variables that are more relevant.
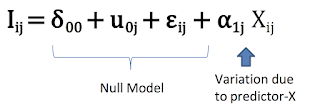
2. Null Model - Start by running a model without any independent variables, to examine the variance within and between your level 2 divisions.
*Incidence = dependent variable
3. Intraclass Correlation - Next, you can use the information from the Null Model to calculate the proportion of the variance
between divisions with respect to the variance within the divisions, using intraclass correlation (ICC):
If the ICC is greater than 5%, there is more information than a single regression model. (Nezlek, 2011; Goldstein, 2011; Heck and Thomas, 2015).
4. Data Centering - In order to have statistical significance, the intercept should correspond to the mean value of a predictor at 0, which may not be the case for some predictor variables. If such occurs, center the variable data using the following:
5. Random Intercept Model - You are then ready to consider the variation of the independent variables:
This returns a Schwartz Bayesian Criteria (BIC) value, which measures how well the model fits, and its improvement in relation to the BIC of the Null Model and the previous predictor. The BIC difference is considered significant if greater than 10, while less than 2 makes it irrelevant (Raftery, 1966) .


Comments
Post a Comment